Building A Sui NFT Marketplace Volume Tracker With Indexer.xyz

Building A Sui NFT Marketplace Volume Tracker With Indexer.xyz
In this tutorial, we'll build a React application that fetches and displays market data from a GraphQL API provided by Indexer.xyz. Our application will allow users to see volumes for different markets over various timeframes. We will utilize the Indexer.xyz GraphQL query layer for data fetching and show you how to implement that into a real live application.
Prerequisites
To follow this tutorial, you'll need a basic understanding of JavaScript, React and GraphQL. Familiarity with hooks and the fetch API in JavaScript will also be helpful. Lastly, make sure Node.js and npm are installed on your machine. You will also need to get API keys from Indexer.xyz.
Setting Up The Project
Firstly, create a new React application using the create-react-app command:
npx create-react-app market-data-visualization
Then, navigate into the newly created directory:
cd market-data-visualization
Now, let's create our main components for our React application. We are going to create two functional components: MyTable and App.
Building The MyTable Component
The MyTable component is the core of our application. This component fetches the data from the GraphQL API and displays it in a table format.
const TIME_FRAMES = {
  '24h': 24 * 60 * 60 * 1000,
  '7d': 7 * 24 * 60 * 60 * 1000,
  '30d': 30 * 24 * 60 * 60 * 1000,
  'all': null,
};

function MyTable() {
  // component code here...
}
In the MyTable component, we declare a TIME_FRAMES object that specifies various timeframes in milliseconds. We also define some state variables to keep track of loading status, any possible errors, the currently selected timeframe, and the fetched data.
Then we define a fetchQuery function that generates a GraphQL query to fetch market data over the selected timeframe.
  let timeframeCondition = '';
  if (TIME_FRAMES[timeframe]) {
    timeframeCondition = `, block_time: {_gt: "${new Date(Date.now() - TIME_FRAMES[timeframe]).toISOString()}"}`;
  }

  const query = `
    query {
      sui {
        actions_aggregate(where: {type: {_eq: "buy"}, market_name: {_eq: "${marketName}"${timeframeCondition}}) {
          aggregate {
            sum {
              usd_price
            }
          }
        }
      }
    }
  `;

  return fetch('https://api.indexer.xyz/graphql', {
    method: 'POST',
    headers: {
        "x-api-user": "YOUR-USERNAME",
        "x-api-key": "YOUR-API-KEY",
        "apikey_type": "prod",
        "role": "prod-user",
        "host_name": "api.indexer.xyz",
        "Content-Type": "application/json",
    },
    body: JSON.stringify({ query }),
  })
  .then(response => response.json())
  .then(response => response.data);
}
Fetching and Displaying Data
Next, we use the useEffect hook to fetch data from the API when the component mounts or the selected timeframe changes.
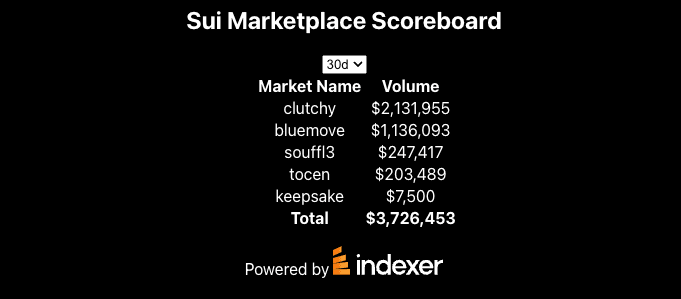
After the data is fetched, we sort it by volume and display it in a table. The user can select a different timeframe, and the table will update accordingly.
useEffect(() => {
    setLoading(true);

    const marketNames = ['souffl3', 'bluemove', 'clutchy', 'tocen', 'keepsake'];

    Promise.all(marketNames.map(marketName => fetchQuery(marketName)))
      .then(responses => {
        setData(
          responses.map((response, index) => {
            return {
              market: marketNames[index],
              sum: response.sui.actions_aggregate.aggregate.sum.usd_price,
            };
          })
        );
        setLoading(false);
      })
      .catch(error => {
        setError(error);
        setLoading(false);
      });
  }, [timeframe]);

  if (loading) return <p>Loading...</p>;
  if (error) return <p>Error :(</p>;

  const sortedData = [...data].sort((a, b) => b.sum - a.sum);

  return (
    <div>
      <select value={timeframe} onChange={(e) => setTimeframe(e.target.value)}>
        {Object.keys(TIME_FRAMES).map((key) => (
          <option key={key} value={key}>{key}</option>
        ))}
      </select>

      <table>
        <thead>
          <tr>
            <th>Market Name</th>
            <th>Volume</th>
          </tr>
        </thead>
        <tbody>
          {sortedData.map((item, index) => (
            <tr key={index}>
              <td>{item.market}</td>
              <td>{Number(item.sum).toLocaleString('en-US', { style: 'currency', currency: 'USD', minimumFractionDigits: 0, maximumFractionDigits: 0 })}</td>
            </tr>
          ))}
          <tr>
            <td><strong>Total</strong></td>
            <td><strong>{sortedData.reduce((total, item) => total + item.sum, 0).toLocaleString('en-US', { style: 'currency', currency: 'USD', minimumFractionDigits: 0, maximumFractionDigits: 0 })}</strong></td>
          </tr>
        </tbody>
      </table>
      <p>Powered by   <a href="https://indexer.xyz"> <img src="https://indexer.xyz/indexer-logo.svg"></img></a></p>
    </div>
  );
}
Wrapping Up With The App Component
Finally, we create the App component that renders our MyTable component.
  return (
    <div>
      <h2>My Table 🚀</h2>
      <MyTable />
    </div>
  );
}

export default App;
And there you have it! You should now have a working scoreboard of the top Sui NFT marketplaces allowing you to filter by different time frames all enabled by Indexer.xyz's NFT indexer.
If you want to skip the tutorial and go straight to the fun part you can also just check out the GitHub Repo
You can also check out the Demo HERE